


Carnivore Diet 90 Day Review, Part 4
Statistical correlations of performance and recovery on a nose-to-tail carnivore diet.


This is a plot of correlations with significance (p) < 0.05. However, that’s only 95% confidence and 5% chance. So let’s take a closer look.
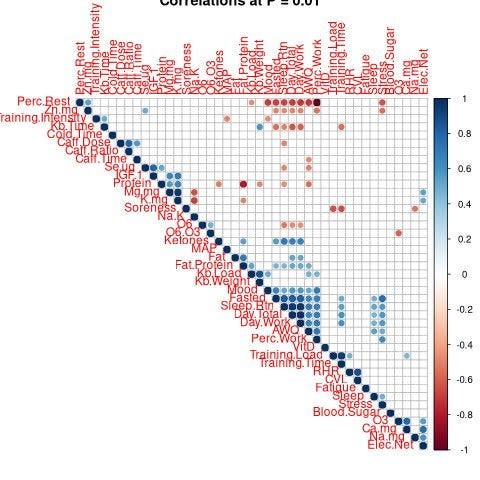
The next plot shows correlations that are significant at the 0.01 level (99% confidence). Again though, we have a lot of variables here so let’s raise our standards.
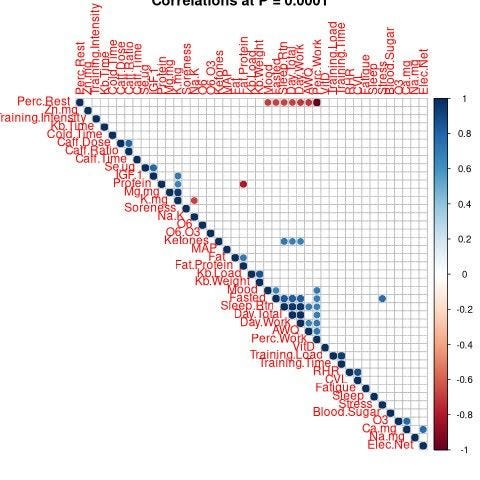
Finally, we’re at 99.9% confidence (p = 0.001). I’ll return to this graph, but first let’s get really picky and see what things look like at 99.99% confidence (p = 0.0001).
Now, let’s dig in! On the left diagonal you can see that each variable has a perfect, positive relationship with itself (obviously). Let’s take a look at the negative correlations first:
Discussion:
Percent Rest days had a significant negative relationship with Mood, Fasting Time, Sleep Routine, Total Days, and Rest Days, AWQ, and Percent Work. The days and percents are relatively easy to explain. As time went on, more days added up, rest percent went down, and work day percent went up. I’ll compute ANOVAs in the next part to unpack more complicated relationships, but I don’t think we need t do that with Rest Percent x AWQ. The other significant relationships with AWQ (below) will tell that story.
Protein had a significant negative relationship with Fat:Protein ratio. This is, again, is somewhat expected as when I added food, there was typically protein and fat, and added fats were minimal. In a similar way, Potassium had a significant negative relationship with Sodium:Potassium ratio. I think this is because my sodium intake had a smaller range (variance), whereas the potassium had a greater variance and therefore greater affect on the ratio.
Next, let’s see the positive correlations:
There’s a lot to unpack here… Let’s start with the easy stuff. Caffeine dose has a more significant relationship on caffeine ratio than does caffeine time. In other words, there’s a limit to how fast I can consume the coffee and much easier to make a stronger brew. As for selenium and potassium being related to IGF1 (note, not actual syrum IGF1, just factors related to IGF1 production), selenium looks to have the greatest variance of the factors measured (Se, Zn, Mg).
My protein sources appear to have a high potassium content, hence there’s a positive relationship there — perhaps something to take note of in the future. Ketones had several positive relationships: sleep routine, total days, work days. This suggests to me, that irrespective of rest percent, as time progressed, my sleep routine became more rigid, and increased (urine) ketones.
One note on Kb.Load (time * weight) was that weight had a positive relationship with load. This suggests that it’s easier to increase the weight rather than decrease the time (to complete the workout). In contrast though, overall training load was more strongly affected by training time rather than training intensity. This could be because it’s easier to add volume with rucking (for example) than higher intensity activities (weight lifting, jiu jitsu, etc.).
Mood had several positive correlations, however, many of them appear attributable to increased time (length of study). As with many other variables, they increased or decreased over time (e.g. Percent Work Days, Total Days). A similar trend can be noted with correlations to fasted (time). Two relationships that will be looked into further are fasted time x AWQ (recovery) and fasted time x stress.
My sleep routine became more strict over time, so we see that in the relationship with total days and work days. However, sleep routine had a strong correlation with sleep routine; in fact stronger than sleep itself.
Wrapping up, cardiovascular load (CVL) was more strongly correlated with resting heart rate (RHR) than with mean arterial pressure (MAP, blood pressure). Omega-3 had a positive correlation with calcium, which is expected because on high Omega-3 days (whole / canned) fish was the primary source. For similar reasons it appears that calcium had a strong relationship with overall electrolyte intake (Elec.Net) likely due to the high degree of variability in calcium intake.
Conclusion:
Most of the significant (p = 0.0001) correlations were affected by the duration of the trial; that is, increased or decreased as time when on. Many of these relationships are expected given other correlated variables. I won’t perform covariate analysis on all of the variable mentioned above, though the data remain open source should anyone be curious.
In the next part we’ll look specifically at relationships dealing with performance and recovery which were the actual focus of this study.