


Carnivore Diet Health Checkup 2021
Happy 1 year carniversary to me! He’re I’ll review some blood work and other health metrics to see if I’m destroying my body or not. You…


Happy 1 year carniversary to me! He’re I’ll review some blood work and other health metrics to see if I’m destroying my body or not. You can catch the audio version on The Kombat Kitchen Podcast.
A 2018 report ( 1) indicated that only 12% of the American population is metabolically healthy; that is, 88% meet at least one criteria for metabolic syndrome ( 2).
I’ve written about this before, but just a quick recap, here’s what we’re looking for:
Percent Body Fat (rather than the recommended waistline, alone)
Low Triglycerides (cholesterol)
High HDL (cholesterol)
Low Cardiovasuclar Load (rather than the recommended blood pressure alone)
Low Fasting Blood Sugar (and HgA1c, and low “area under the curve”)
Body Fat
I much prefer this metric over waistline alone, for the same reason(s) that BMI (body mass index) alone is a worthless measure. It tells us the density (mass) of our body, but nothing of what that mass is composed of (e.g. muscle, fat, bone, blood, water?). Here are my measurements (taken 1/23/21) before my last fight:
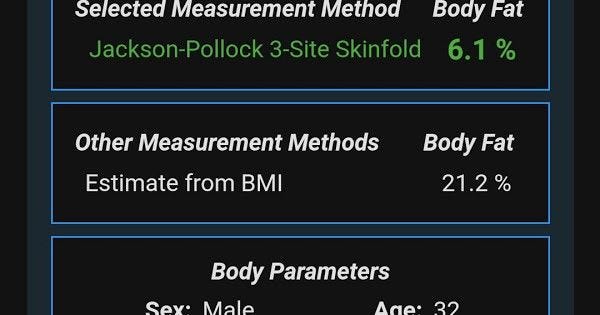
With a BMI of 25.4, both the CDC ( 3) and AHA ( 4) would classify me as overweight. As you can see, that’s clearly not the case.
Obviously I’m very lean, especially leading up to a fighting sports competition. Truth be told, that’s not what I normally walk around at, so for reference here’s the criteria I use (both for my clients and myself).
Men: Body fat < 15%, < 10% for high performers (this is my “walk around” weight)
Women: Body fat < 20%, < 15% for high performers
The American Council on Exercise says that essential body fat for men is 2–5% (10–13% for women) and that male athletes should be between 6–13% (14–20% for women)( 5). Call me crazy, but given our contry’s metabolic unhealth, I think everyone should be “an athlete.” So, adjusting ACE’s numbers to something easy to remember brings us to a threshold of 10% for men and 15% for women (who I’d dub “competitive athletes”). On the higher end, I’m willing to accept 15% / 20% (men / women) for “regular athletes” or what I think would be an appropriate benchmark for the general population ( 6).
So, putting everything in context, if you adhere to the CDC and AHA guidelines, I’m overweight and underfat. Wait… what?! The BMI chart that’s in every office in every hospital in America is literally telling me to lose muscle and gain fat?! SMH… moving on….
Cholesterol
Cholesterol gets a notoriously bad reputation and, likewise, myself and many other have written about it before ( Nadir Ali, Dave Feldman, and many, Kevin Stock), and dozens of podcast episodes — DM me if interested). So, what numbers really matter. Desperately trying to plummet cholesterol is a very bad idea for a number of hormonal, immune, and cognitive reasons, but that’s worth several discussions all on it’s own.
The diagnostic criteria for metabolic syndrome are concerned with:
When we put these numbers together we get a ratio of TG:HDL which, as we’re learning, is a much better predictor of cardiovascular disease than TC (total cholesterol) or even TC:HDL ( 9, 10). AHA recomends this ratio be below 5 (5:1) and that a “healthy” person with a TC of 200 and HDL of 50 has a ratio of 4:1 ( 11). A ratio of 3.5:1 is considered very good ( 12), so the lower the ratio, the better.
If you’re dead set on using the TC:HDL method ( 13), we can look at that too. Recommended at 4:1, with lower being better, we’re still heavily dependent on a high HDL to improve this number (or if you prefer, lowering TC; again, bad idea).
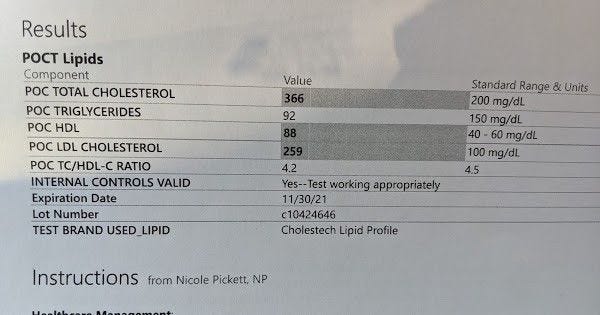
Obviously I got the standard lecture about total cholesterol and “bad” LDL cholesterol (a topic under much debate these days) and there was little mention of my phenomenally high HDL(double what’s considered “good”), and absolutely no mention of equally phenomenal triglycerides that were about half what’s considered “normal.” I didn’t get into a debate with the NP administering the test because I knew it’d e futile. At any rate, as mentioned above, triglycerides and specifically TG:HDL ratio have been shown to be much more closely correlated with CVD than LDL or TC alone or without context. So, how did I stack up in the measures I care about:
You could say that I’m biased towards my own position, but I feel like the above “recommendations” are geared towards (1) selling medications to (2) a grossly sick population. What if rather than trying to keep our total cholesterol under 200, the entire US had an HDL over 80 and TGs under 120?!
Cardiovascular Load (Heart Rate and Blood Pressure)
I have talked a lot about this in the past as well, partly because I did a lot of homework after dozens of doctors told my my blood pressure was high. It didn’t make sense to me that the pressure (or torque if you will) on the heart would be the only thing we look at; especially when my resting heart rate (RPMs in car terms) is extremely healthy.
Turns out, there is actually a term for this; cardiovascular load. It is the product of multiplying your MAP (mean arterial pressure) by your pulse to get a single number indicating total stress on the heart (as the name implies). Common blood pressure guidelines ( 14) recommend 120 / 80; and the metabolic syndrome criteria is at 135 / 80. We’ll come back to these…
A “normal” heart rate is between 60–100, which is an average of 80 beats per minute. So, let’s do some quick math:
Now, let’s see where I fall in to this:
* 7 days, n = 5; 1 year, n = 25; see screeshots from Cronometer

I’m not a fan of “fitness trackers” or even “smart watches” for that matter, but I have to say that my FitBit Inspire 2 was a pretty useful impulse buy. I was in need of a watch and, frankly, am not a fan of most men’s watches (being huge and gaudy). I wanted something sleek and subtle. As a bonus, it also tracks my sleep patterns and heart rate (perfect for monitoring recovery); and is cheaper than an Oura ring. A recently added feature was heart rate variability which I’ll get to in a minute. I’ve only had my FitBit for about 3 months, so for the 1 year CVL calculation I’ll be using my 3 months average heart rate (59 bpm), and for the 1 week CVL calculation I’ll use my 1 week average heart rate (61 bpm).
So, you can see that my CVL over the past week (6649) is similar to a person with “normal” biometrics of 120/80 @ 70 bpm. What’s more is that over the past year my CVL is 6068, far below the “normal” CVL in spite of my elevated systolic blood pressure.
Heart Rate Variability:
This is a new variable this year. I had read prior that HRV is an important factor in recovery, but without a heart rate monitor you can’t measure it. Since I have one now (!) I did a little digging through PubMed. Simply put, HRV is the time between heart beats (this is a separate measure from beats-per-minute). In a sense then, a higher HRV value means a longer time between beats which means each beat is shorter — i.e. you’re getting a stronger pump per beat. “People who have a high HRV may have greater cardiovascular fitness and be more resilient to stress( 15).”
Additionally, stress appears to lower HRV and indicates increased sympathetic nervous system functioning (e.g. chronic “fight or flight” mode)( 16, 17). Psychosocial factors such as isolation, depression, and poor emotional regulation are also associated with lower HRV — again, more indicative of a persistent (psychological) fight/flight state ( 18). Since sport psychology is it’s own field, it shouldn’t be a surprise that psychological state is related to sport performance and recovery as well ( 19, 20, 21, 22). Though we should also note that significant alterations in HRV in either direction (high or low) can also impact performance negatively.
Since HRV can vary from person to person, there aren’t established refernce ranges like for blood pressure. However, the fitness trakcer Whoop states that for all their users is 65 for men and 62 for women… 70 for 25 year olds, and 60 for 35 year olds( 23). However, endurance athletes can have an HRV down in the 40s ( 24). What we’re really looking for (to avoid) is an acute decrease (25%) from your baseline HRV as an indicator of acute stress (e.g. overtraining, or underrecovery as I call it)( 25). Over time though, and with training and appropriate recovery you should see a gradual increase in HRV ( 26).

The HRV monitoring was only added to my FitBit in a recent upgrade, so I only have about one week’s worth of date. Over that time my average HRV was 53 ms, which is a little on the low side and I’d like to see it closer to 60/62 according to Whoop’s reference ranges. The SD (standard deviation) over the past week was 10.19 (19.23%) which is pretty good, considering we’re trying to stay under that 25% acute stress marker. This is also where context matters. You can see by the graph above that I actually did stay around that 60 ms mark most of the time, but after a hard training day on Saturday, my Sunday HRV tanked to 40 which is obviously going to have a more significant effect with a small sample size (n = 7).
Blood Sugar (Insulin Sensitivity)
The CDC gives the following recommendations ( 15), in line with the ADA ( 16):
Fasting Blood Sugar: < 100 (normal), 100–125 (pre-diabetic), > 125 (diabetic)
Blood Sugar 2 Hours Later: 100–125 (normal), 125–140 (pre-diabetic), > 140 (diabetic)
A1C: < 5.7% (normal), 5.7% (pre-diabetic), 6.5% (diabetic)
Diabetes:M says my (estimated) A1C is 5.3, well below the “normal” or prediabetic mark (5.7). I have to admit that I got a bit lazy with my blood sugar checks this time around as I didn’t mark the meals/times or whether or not I was fasted. Over the past year, my average blood glucose was 91 (n = 139) with 0% variability — awesome! If my average blood sugar is below what’s considered normal for fasting, we’re doing great! In the past 7 days the average was a little higher (98, n = 23); though still under 100 and with low variance 5.1%.

Conclusions:
Clearly I am not metabolically broken. I’ve got low body fat, high lean body mass, and my cholesterol is a at a fantastic level when taken into the context of my other metabolic factors (e.g. not diabetic, low/zero carb, highly active, low body fat, etc.).
My blood pressure is a little high, but I’ve begun to wonder about nuance here as well. That is, we often hear that one of the reasons sodium is “bad for us” is that it causes water retention, leading to higher blood volume and thereby blood pressure. Now, certainly I consume a lot of sodium, but no test I’ve ever done has shown a significant effect; particularly one that outweighs the negative detriments of too little sodium (more on this later). I’ve started to rule in conditions like diabetes insipidus; which would explain some of these issues independent of sodium consumption.
My birthday is coming up soon, so there are a few other things I may tack on to this post (or write a follow up) such as:
Testosterone (I don’t think it’s low, but want to have a reference point for the future)
CBC (for serum electrolytes)
Coronary calcium scan (is that cholesterol really killing me?)
CRP (c-reactive protein / inflammation)
So, that’s it for my annual self-checkup! Eat steak and play in the sun!