
What I Eat in a Day: 2024, Part 1
Are supplements worth it and accidentally "debunking" organ meats.

The USDA’s food pyramid — and corresponding food groups, and Swedish origins — have more to do with food costs than “optimal nutrition.” Here I’ll closely examine both nutritional and financial “pyramids” with multi-week data sets of what I actually eat in a day.
There are a few points I’d like readers to keep in mind as we work through this two-post series (stay tuned for next month!). First, not “needing” something is not the same ass “not getting any benefit” from it. Purists will say that you don’t “need” coffee, variety, supplements, etc. You also don’t “need” to be healthy to survive, and you certainly don’t “need” to live an ass-kicking life. However, should you choose to, you should do so in an manner that’s informed of consequences and outcomes.
Secondly, when one’s expectation is excellence, and comparative measures of performance fall “outside normal reference ranges”, the function of one’s “needs” changes dramatically if we’re talking about biological survival versus Olympic-level performances.
Third, don’t conflate your priorities and don’t inflate your belief in your abilities (regarding the above). Reality and achievement set the tone for this discussion, not desire or hope.
I learned a lot throughout this process myself, which is why, on top of gobs of data, it’s broken down into an observation (Part 1) and (re)application (Part 2). Specifically, the data taught me about what my habits and laziness were really costing me, and questioned some of my beliefs about “super foods.”
Introduction:
The term “superfood” is about as obnoxiously overused as “optimal” or “intense.” Most people are regurgitating these cliches and talking points without an understanding of the foundational reference point.
As the trope goes, lifetime intermediates and social media trolls alike will ask; “Where’s the study that says X is optimal?” To which I always reply, “Show me your optimal performance worth studying.”

Force of Nature (ref.) makes some great points here, how and why you can benefit from eating organ meats — which extends far beyond biology. Since it’s publication, I’ve relentlessly shared and cited Tye Bel’s paper on micronutrient density (ref.) — summarized below.
Many prominent names in the carnivore / animal-based scene don’t eat any organ meats and seem to do just fine. In fact, they’re rightly critical of some of the other advocates of organ meats also conveniently selling organ supplements — sometimes with unscrupulous tactics. Worse yet, there’s the antics — which I admit to having taken part in — of eating raw organs that further isolates and pushes people away from what otherwise might be life-changing dietary intervention.

Over the summer of 2023, Jamie Seeman (@doctorfitandfabulous) posted a pyramid graphic of her food pyramid with the prompt to “screenshot and make it your own.” Off the cuff, this is what I came up with:

A (Real) Food Pyramid:
The above template will be the basis for our discussion and comparison of different models. For example, do “staples” really account for 80% of my calories, 80% of my grocery budget, and 80% of my mincronutrients?
I analyzed data from three weeks of eating (January - February 2024) in Cronometer to compare how nutrients-per-calorie, nutrients-per-dollar, total dollars, and convenience costs applied to the following categories:
Staples: fresh meat, eggs, salt — the “lion” items.
Supers: fish and organ meats - the heavy hitters from Tye’s paper.
Snacks: milk, butter, cheese, packaged meat, condiments - convenient alternatives or add-ons for staples.
Supplements: anything not included above - for the purposes here, beer is included, but as I discussed in my article on alcohol this is really an “entertainment” cost rather than grocery, but more on that later.
In Figure 1 you can see a comparison of the “model” from the above template with the actual data representations in calories, cost (dollars), and average nutrient density.
The calorie and cost calculations are pretty straight forward. The nutrient scores are a composite average of the percent of total intakes of each:
Sodium
Potassium
Calcium
Magnesium
Folate
Zinc
Vitamin A
Omega 3 Fatty Acid

Nutrients excluded from the analysis were Vitamin D and B-Vitamins (2, 3, 5, 6, and 12). My dietary sources of Vitamin D are usually between 300 and 600 IU / day. This is a drop in the bucket compared to the thousands of IUs I get from the sun or supplements, so it would have greatly skewed the overall nutrient ratings.
Regarding B-Vitamins, the free version of Cronometer only lets you highlight 8 nutrients and typically if you’re eating large amounts of meat you’re getting 2-3x the RDA of these vitamins anyway.
For pricing comparisons, conventionally raised beef, eggs, etc. were used because the comparison is easier. As with the Force of Nature post, there are many reasons to support regenerative and organic farms, but as discussed in Sacred Cow, a significant change in absolute (not relative) values of micronutrients isn’t one of them.
For example the price may not be “worth it” in terms of nutrients or calories, but may be “worth it” in terms of avoiding chemicals, decentralizing food systems, supporting local businesses, and regenerating the planet.
See the disclaimer at the bottom of the page regarding discrepancies in data (e.g. cost categories and nutrients).
Looking Deeper: Relative Values
Figure 2 shows the relative density of micronutrients per calorie for our identified categories:
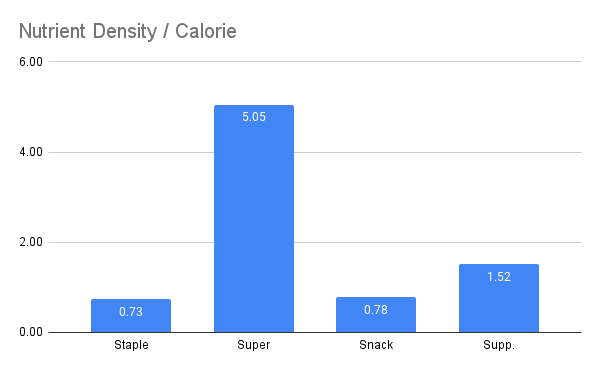
From a macronutrient perspective, my average consumption during this three week period looked like:
3,600 calories / day
54% Fat
38% Protein
7% Carbohydrates / Alcohol
Let’s take another look at “density”, but this time in terms of nutrients per calorie per dollar (Figure 3):
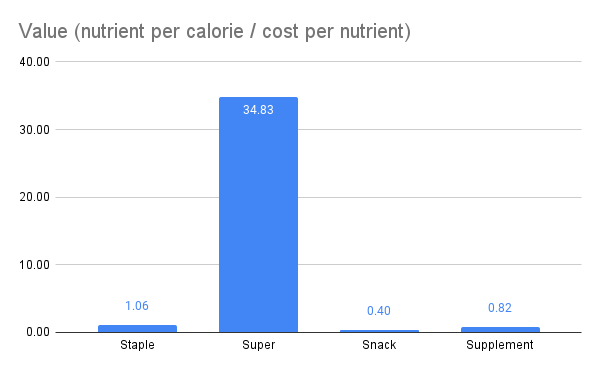
With this information in mind, we can compute an “odds ratio” for convenience! We know that the largest benefit of “snacks and supplements” likely isn’t their nutrient density, but convenience and opportunity. These, and branding, have a lot to with their price tag.

For the comparison in Figure 4 I used the “Staples” category as baseline, value of 1 — you’d be buying / eating it anyway. We can see that the price “odds ratio” for snacks and supplements is 1.66 and 1.24 respectively. This means that the “price of convenience” is +66% for snacks and +24% for supplements.
Surprisingly, I don’t think that’s too bad. Paying 60% more for something when you’re in a hurry isn’t unusual. Consider the price of the same beef-stick at a gas station versus a grocery store. Regarding supplements, we’ll re-define some of these categories and compare some different models (and test them too!) in Part 2.
Zooming Out: Gross Values
Figure 4 paints a very favorable picture of “super foods” — fish and organ meats for our purposes here. However, let’s look back at Figure 1.
While the “Super” category is extremely cost and calorie effective, it still only provided 19% of gross nutrients; a value that was matched by “Supplements” category and more than doubled by the “Staples” category.
This certainly isn’t a “deal breaker” that “debunks” organ meats, but it does give some color to the conversation and explain why so many people do well on a carnivore / animal-based diet without organ meats.
I want to also point out that if you were needing to severely restrict calories for a weight-class-based sport or bodybuilding, then there is more of a case for necessitating fish and organ meats (and supplements). Please note, I’m not talking about losing your holiday beer-and-cookie weight. I’m talking about well below 10% body fat.
That brings us full circle to the initial caveats of what is “necessary” or “optimal” depending on one’s goals.
Summary:
The relevant takeaway seems to be that if you enjoy organ meats, they’re fantastic in terms of nutrients per calorie and nutrients per dollar! However, if you don’t like them, you’re probably not missing out provided you’re already eating plenty of meat and eggs.
Data Availability and Disclosures:
Raw Data: https://gitlab.com/savagezen/research
Annotated Data: https://tinyurl.com/carnivoretests
Note: There may be discrepancies between calorie reports, nutrient density, macronutrient ratios, etc. based on rounding and categorical pricing. The listed price categories are the most common and there isn’t an entry for every literal item.